
Automatic Series and Custom Lists
Roman Kondratiuk
10:09
$9.99 $6.99AUD
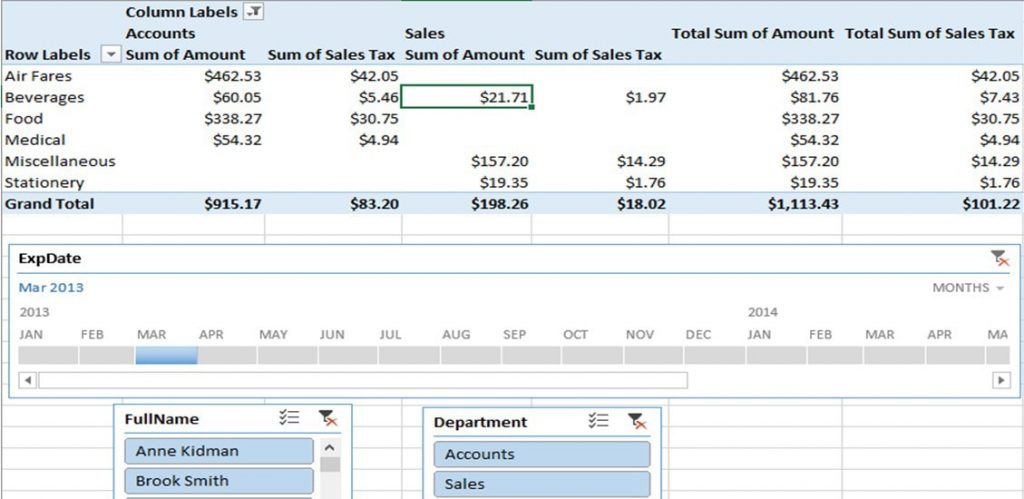
PivotTables are the most powerful data analysis feature in Excel, combining the ability to sort, filter, subtotal, calculate and chart data in minutes.
A PivotTable displays a summary of a selected data set in a condensed format of rows, columns, data fields and pages. These components can be “pivoted” with your mouse allowing you to expand, isolate, calculate, and group the particular data in real time. This table empowers the user to view and analyse large amounts of information.
PivotTables are a “must have” reporting tool enabling quick business decisions, crucial in business, government and academic fields.
PivotCharts provide added enhancement through powerful graphical presentation of PivotTable data.
Understand this power-packed capability of Excel and how you can create PivotTables in minutes “working smarter .. not harder”!